OldCamp Inc.
Simulated company environment

Case studies

Five questions, five interactive dashboards

Every dashboard runs in the browser, with filters, drill-downs, a simulator and access to the source data.

waste.konradkasperek.pl
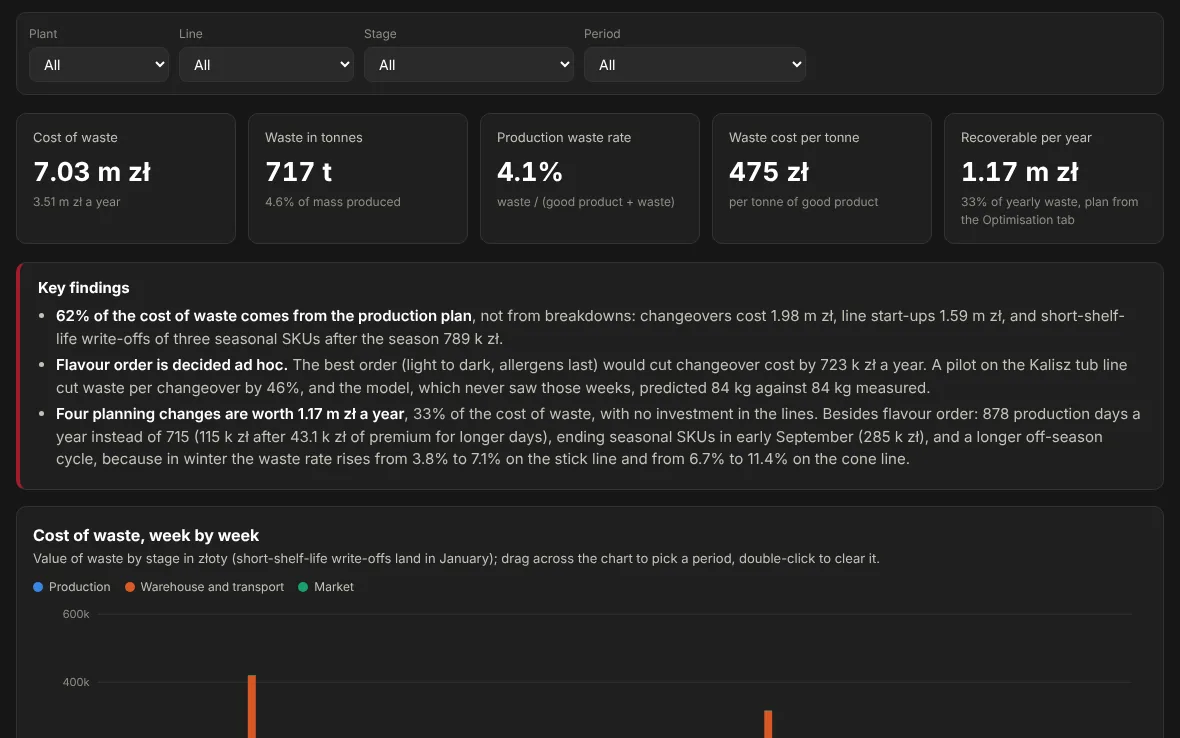
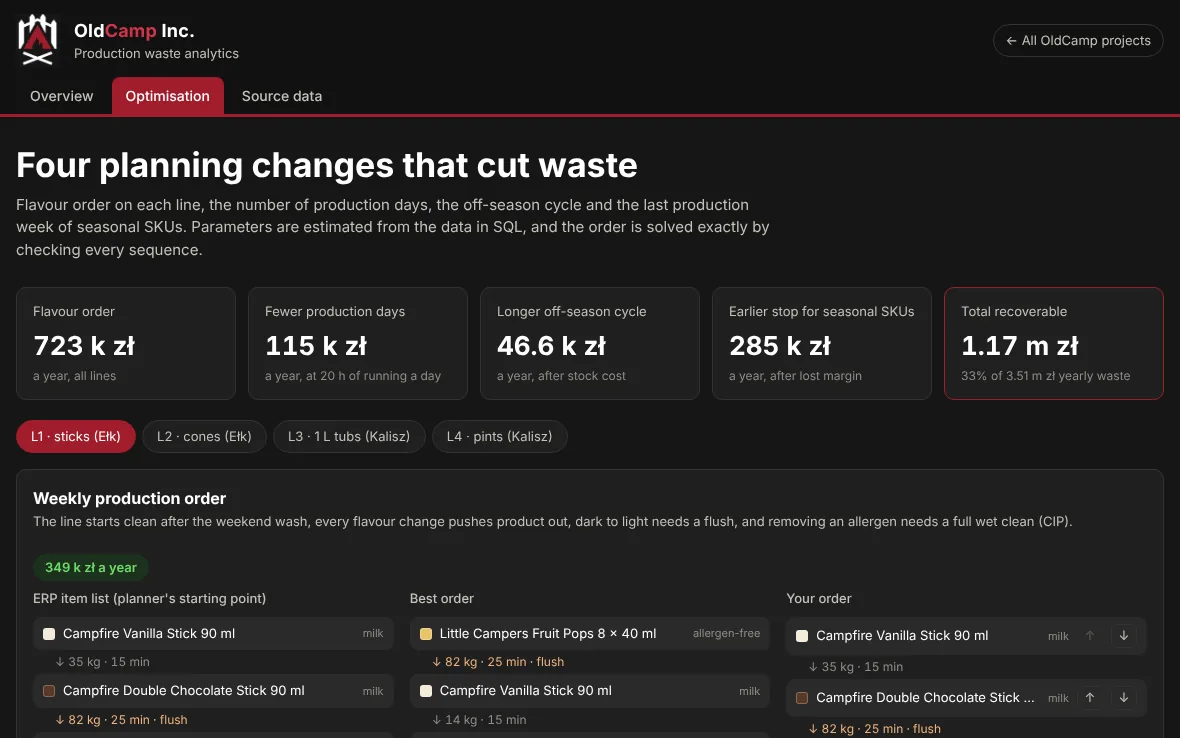
Waste Analytics dashboard: waste cost week by week
01Production

Waste Analytics

Where does OldCamp lose ice cream, and how much can planning win back?

Every kilogram of waste over two seasons is assigned to a stage, line, product and reason, then valued. An optimiser checks every flavour order on every line in every week, and a week-by-week stock replay shows when to stop producing seasonal SKUs.

7.03 m złwaste cost over two seasons
62%of the cost comes from the production plan
1.17 m zła year recoverable, 33% of waste
A model that never saw the pilot weeks predicted 84.4 kg of waste per changeover. The pilot in Kalisz measured 84.1 kg.
OverviewOptimisationSource data
Open dashboard ↗
cfr.konradkasperek.pl
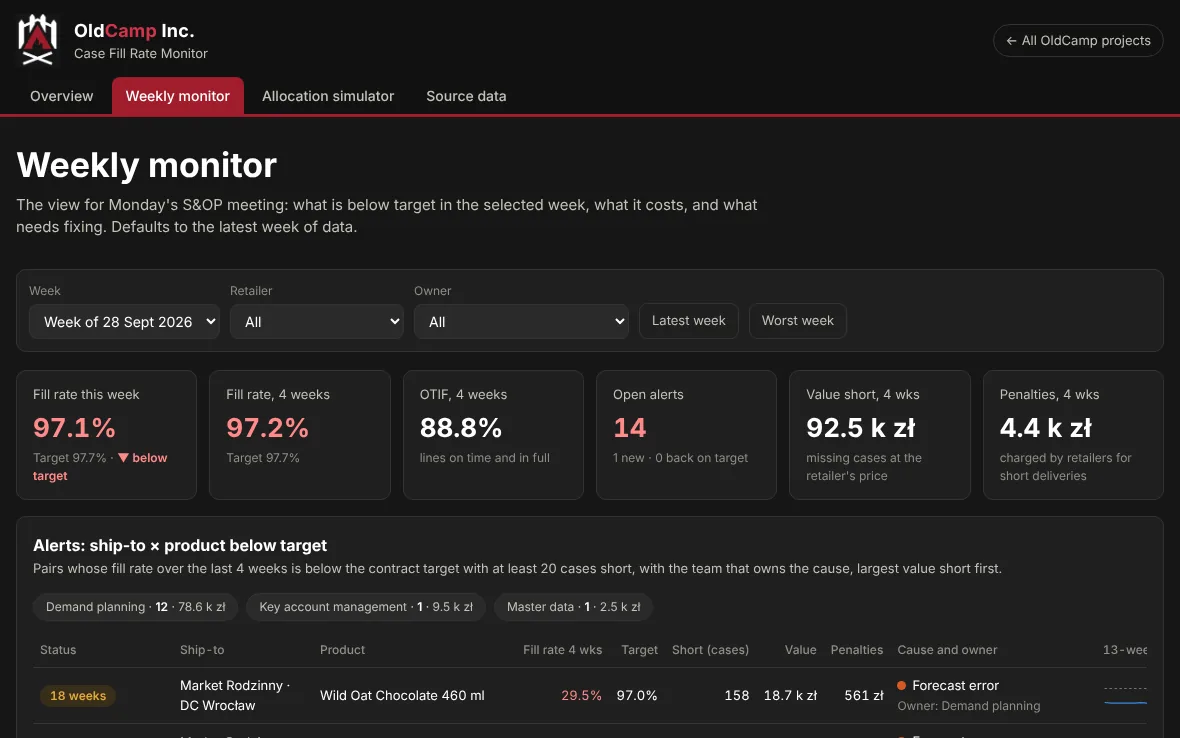
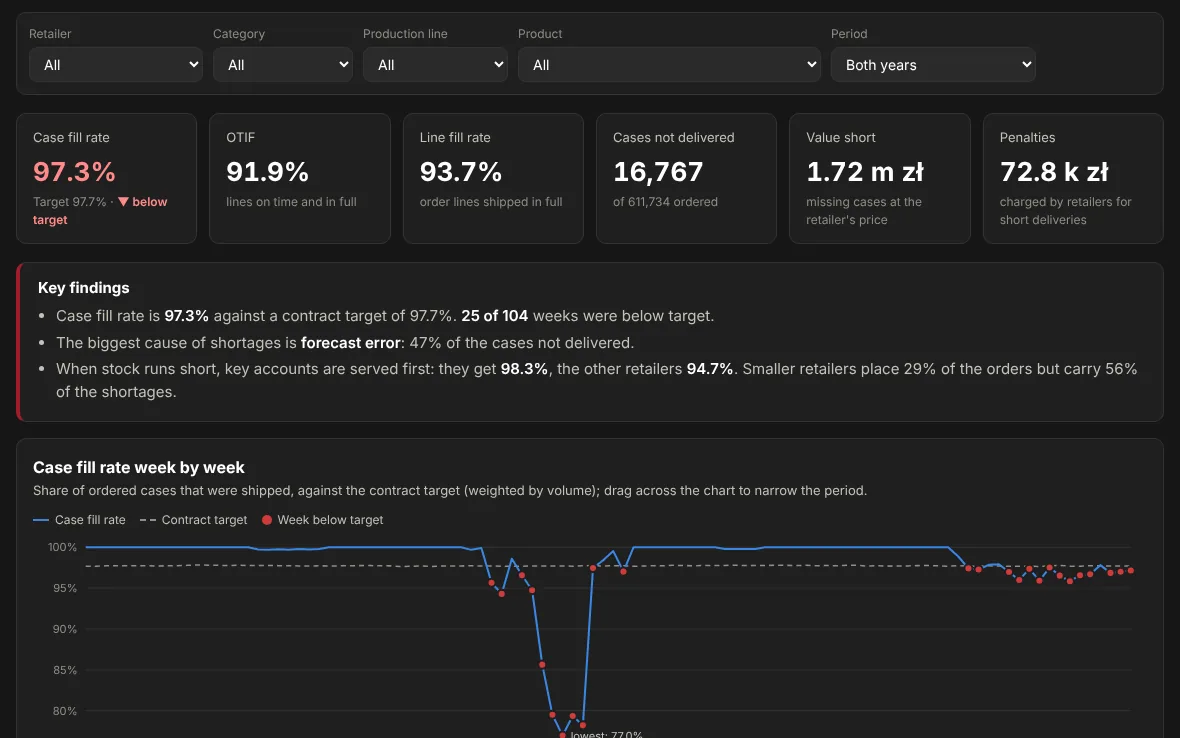
Case Fill Rate Monitor dashboard: fill rate week by week and shortages by root cause
02Retailer deliveries

Case Fill Rate Monitor

How many of the cases retailers order actually arrive, and why don't the rest?

Orders, forecast, production and stock in one model. Every case not delivered gets a root cause derived from the data, because the ERP codes say nothing, and every alert goes to the team that can fix it. An allocation simulator prices the rule that decides which retailers get stock when it runs short.

97.3%case fill rate over two years against a 97.7% target
87%of shortages come from forecast error and capacity
−31%contract penalties under a different allocation rule
The true cause of every shortage is set counterfactually: the simulation is re-run without each problem. The model's rules match on 67% of cases, and the dashboard shows where they miss.
OverviewWeekly monitorAllocation simulatorSource data
Open dashboard ↗
promo.konradkasperek.pl
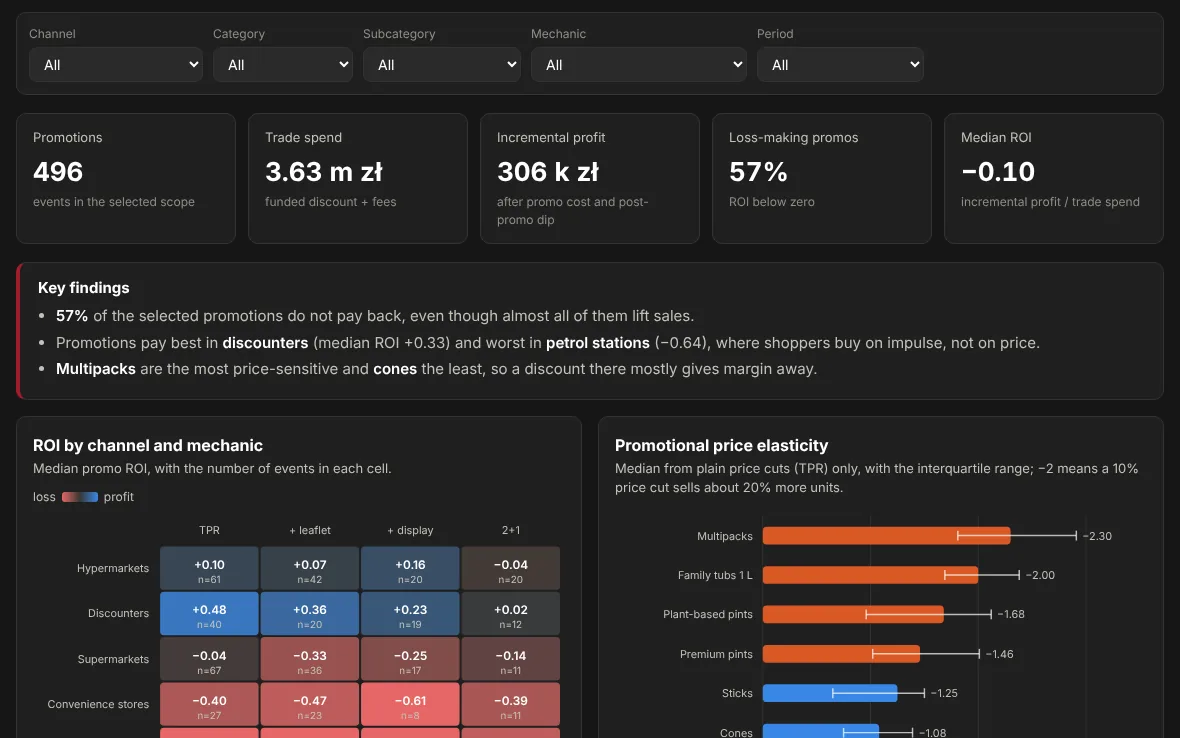
Promo & Pricing dashboard: weekly sales and ROI by channel and mechanic
03Store shelf

Promo & Pricing Analytics

Which ice cream promotions actually make money?

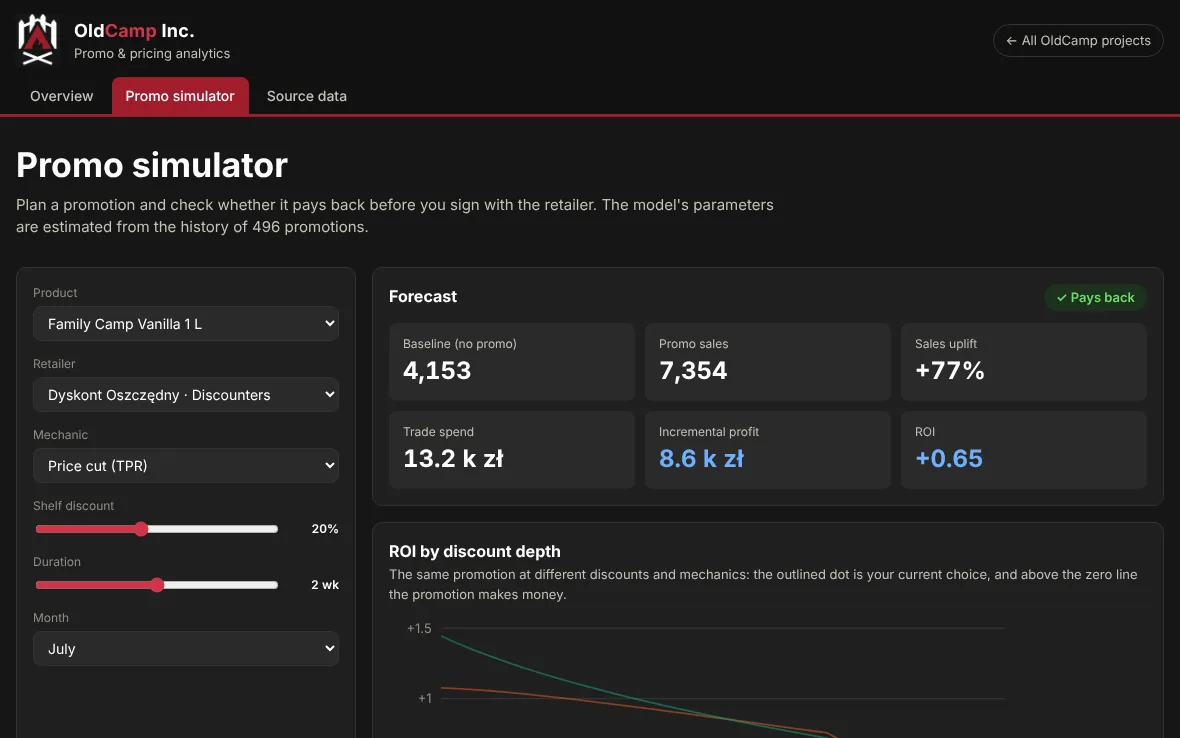
Every one of 496 promotions in five retail chains, settled: sales above baseline, retailer funding, incremental profit and ROI, by channel and mechanic. A simulator prices a new promotion before it is signed with the retailer.

57%of promotions have ROI below zero
522 k złof profit lost on promotions that did not pay
3.63 m złtrade spend over two seasons
Price elasticities estimated in SQL land close to the ground truth built into the data, e.g. multipacks −2.30 against a true −2.19.
OverviewPromo simulatorSource data
Open dashboard ↗
forecast.konradkasperek.pl
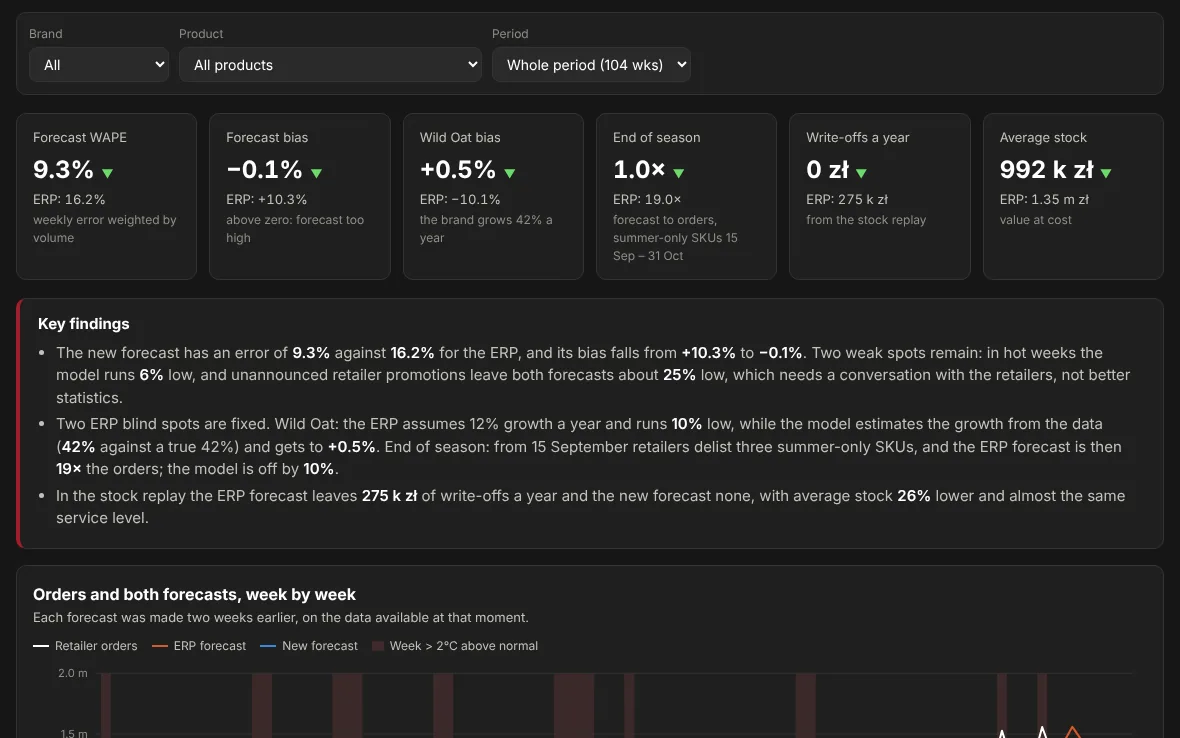
Demand Forecasting dashboard: accuracy of the new forecast against the ERP forecast
04The whole chain

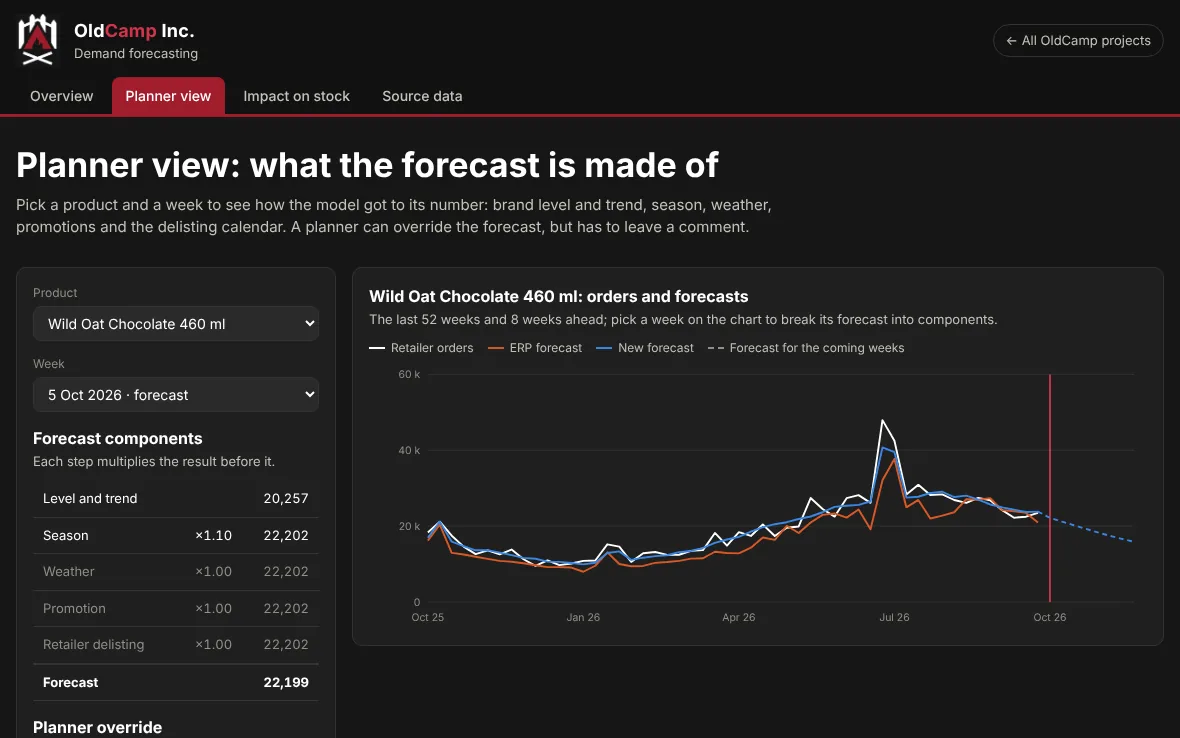
Demand Forecasting

Can the forecast keep up with Wild Oat, the weather and the end of the season?

Forecast error came out among the main causes in each of the three projects. The new forecast is computed week by week using only the data a planner had two weeks earlier: the brand trend, the season, the weather forecast, announced promotions and the listing calendar. A stock replay turns the difference into write-offs and tied-up capital.

16.2% → 9.3%forecast error (WAPE) in a 104-week backtest
−26%stock at the same service level
265 k zła year less cost of forecast error
The model never reads the ground truth in the data, yet it estimates Wild Oat's growth at 41.8% a year against a true 42%. The ERP assumes 12%.
OverviewPlanner viewImpact on stockSource data
Open dashboard ↗
pnl.konradkasperek.pl
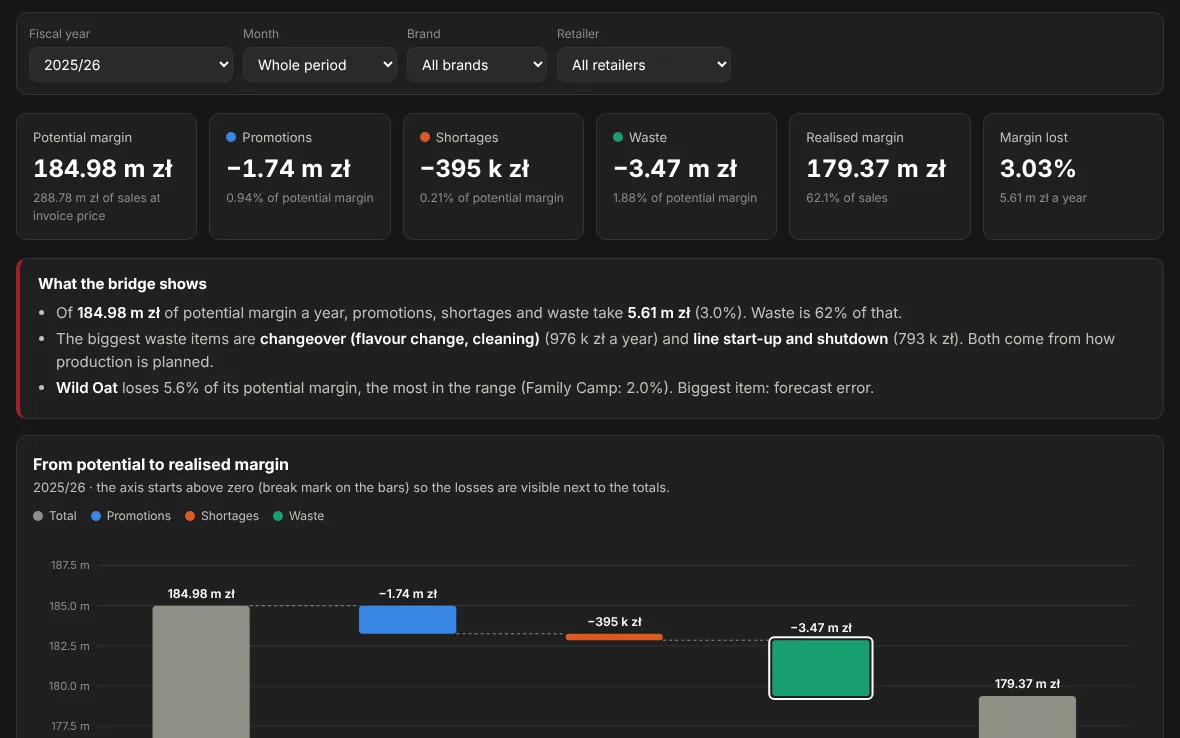
P&L Bridge dashboard: the bridge from potential to realised margin
05Finance

P&L Bridge

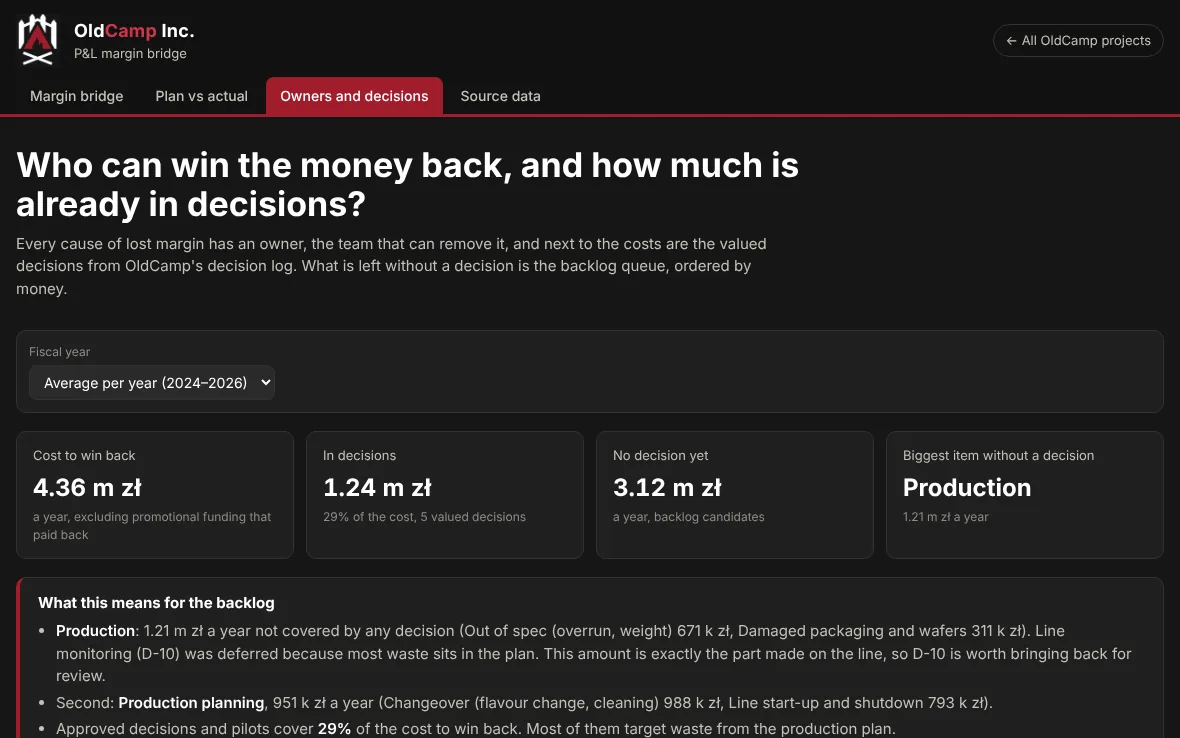
How much margin do promotions, shortages and waste take, and who can win it back?

Three projects each measure one margin leak, each in its own unit. The margin bridge puts them into one account in zł, reconciled with the numbers each project publishes, compares the year with the plan and gives every cause to the team that can remove it.

5.6 m złof margin a year goes on promotions, shortages and waste (3.0%)
−19.8 m złagainst plan, almost all of it ERP forecast volume
29%of the cost to win back is already covered by decisions
The bridge recomputes nothing. Every element matches its source project, e.g. 7.03 m zł of waste in both, and a test checks it on every change.
Margin bridgePlan vs actualOwners and decisionsSource data
Open dashboard ↗